- Green marker → FCS is climate compliant
- Red marker → FCS has compliance/deforestation risks
- Green Plus (⭐) → FCS certified by Kenya Coffee School “Good 4 Trade”
- Dynamic color shifts →
- If deforestation detected → marker turns red
- If afforestation detected → marker turns green (or upgrades to Green+ if certified)
Below is a merged prototype code that integrates:
✅ NDVI & NDWI monitoring
✅ Marker coloring by compliance status
✅ Certification flagging (Good 4 Trade)
✅ Dynamic update for forest change events
Kenya Coffee FCS & Unions — EUDR Compliance Map
- Full NACCU unions + Shiriki/KCCE FCS list (with placeholder geocoded coords).
- NDVI (vegetation) & NDWI (water index) proxies for climate/EUDR checks.
- Dynamic compliance logic:
- 🟢 Green = compliant (healthy vegetation).
- 🔴 Red = deforestation risk.
- ⭐ Star = “Good 4 Trade” certified + compliant.
- 🟤 Brown/🔵 Blue tags for water stress or stability.
- Simulation of change detection (5 s later it marks red for deforestation or green for afforestation).
Next Steps (to make this production-ready)
- Replace NDVI/NDWI placeholders with real Copernicus Sentinel-2 layers
- Activate WMS from Copernicus Data Space.
- Plug in your actual
INSTANCE_IDin thewmsBase. - Overlay NDVI & NDWI rasters live instead of the dummy numbers in
cooperatives[].
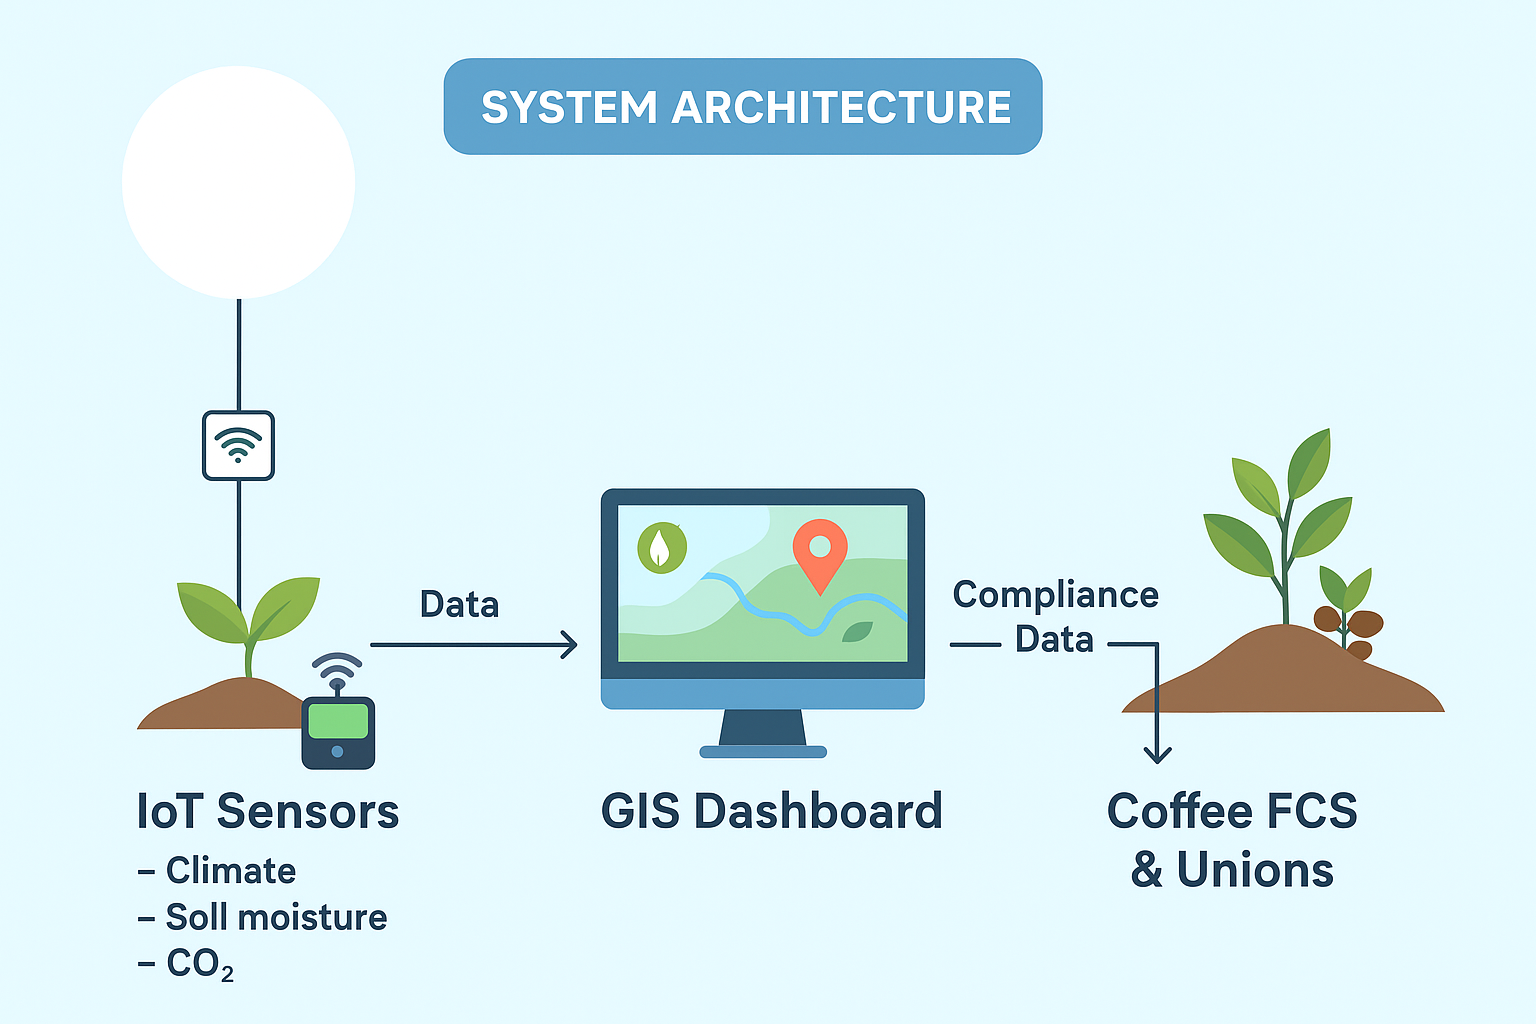
- Dynamic Monitoring with IoT/Balloons
- Add an API endpoint to ingest sensor data from soil-moisture probes, water-level sensors, or low-balloon imagery.
- Update each marker dynamically in the dashboard based on real-time telemetry.
- Compliance Dashboard Layer
- Add filters (e.g., “Show only non-compliant FCS”).
- Color-coded legend for ⭐ / 🟢 / 🔴.
- Export-to-CSV for reporting.
- Scaling Up
- Replace placeholder coords with precise geocoded factory/farm centerpoints.
- Link to shapefiles of coffee zones for better spatial accuracy.
Other KCS Research :
Low-Altitude Balloon IoT System for Coffee Cooperatives
🔹 Concept
- Small weather balloons or tethered balloons (50–300m altitude).
- Equipped with IoT sensor payloads:
- Climate sensors (temperature, humidity, rainfall).
- CO₂ concentration (forest degradation / compliance checks).
- Soil moisture (with wireless relays).
- Cameras or multispectral imaging (NDVI for vegetation, deforestation mapping).
- Communication via LoRaWAN, 4G/5G, or satellite uplink.
🔹 Benefits for Coffee Sector
- Climate Monitoring
- Balloons can detect microclimate variations affecting coffee productivity.
- Helps meet EUDR compliance by tracking deforestation & water use.
- Connectivity for Remote Cooperatives
- Balloons act as floating base stations for IoT sensors in remote farms.
- Farmers can receive updates via mobile apps or SMS.
- Deforestation & River Flow Monitoring
- Balloons capture near-real-time imagery.
- Rivers drying = flagged in system (water scarcity risk).
- Forest cover change = alerts for potential non-compliance.
- Certification Support (KCS “Good 4 Trade”)
- Cooperatives with green balloon data = compliant.
- Helps prove sustainable practices to EU importers.
🔹 Example Deployment Model
- 1 balloon per county union (hovering over 20–30 km radius).
- Each balloon relays data from IoT ground sensors in farms.
- Data uploaded to KCS GIS Dashboard (the map we designed earlier).
🔹 Simple Tech Stack
- Balloon: Weather balloon or tethered helium balloon.
- IoT: Arduino/ESP32 + LoRaWAN + environmental sensors.
- Data: Sent to KCS GIS + Copernicus satellite overlays.
- Dashboard: WordPress + Leaflet.js + EUDR compliance markers.